How to Objectively Analyse a Football Team’s Last 6 Matches
In this lesson, I will explain how to objectively analyse a football team’s last 6 matches. Many people just scroll down the list of the last 6 matches and say to themselves:
“Man Utd” should have won that match because they were odds-on" OR
“Brighton excelled in that match because they were outsider and they managed to get a draw”.
The implication is that Man Utd is not on form, while Brighton is on form. In this lesson, I will explain how we can do much better than that!

A. Football is Not Just About Skill – It is Also About Luck
It’s important to remember that odds reflect probabilities and not certainties.
We always need to remember that there is a large element of luck in football. This is why the bookmakers present odds. Each team has a probability of winning, drawing and losing. There are no certainties.
Therefore, our analysis should answer the following questions:
- Has our target team been over-achieving, under-achieving, or performing as expected?
- Has our target been lucky or unlucky or has their luck been just about right?
In this analysis, I will look at home form for the home team and away form for the away team.
However, we can use the following procedure on the last 6 matches, regardless of whether their matches were at home or away.
B. Has Our Target Team Been Over-Achieving, Under-Achieving, or Performing as Expected?
This question is answered for you within the Poisson Calculators.
I will explain both how to interpret the information from my calculators and how to do the calculation yourself.
If you want to do calculations yourself, you can obtain free raw football data from https://www.football-data.co.uk/
Step 1: Compared Expected Points to Actual Points
When you choose your teams in the Poisson Calculator, 4 tabs will appear at the top of the calculator. These tabs are:
- Stats (1yr) – 1 year statistics
- Last 6 games (H vs A) – Last 6 Home games for the home team and last 6 away games for the away team
- Last 6 games (All) – The last 6 matches, regardless of whether the matches were home or away matches
- Stats (Last 6) – Statistics for the last 6 matches.
Figure 1: Last 6 Matches (Home vs Away)
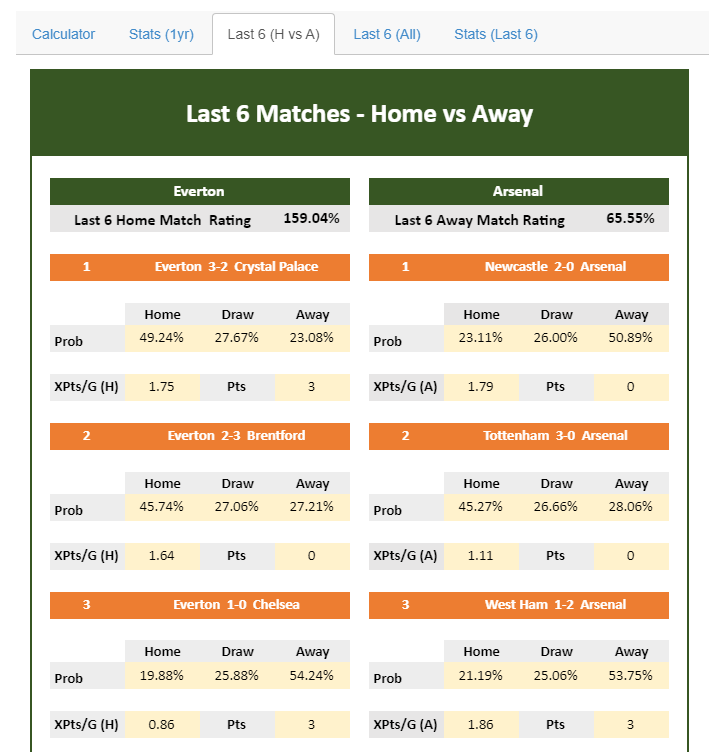
If you click on the tab, “Last 6 games (H vs A)”, you will see the last 6 home and away games for the home and away team, respectively. The figure above just shows 3 of the last 6 games.
I will explain what everything means inFigure 1.
1. Last 6 Match Home or Away Rating and Last 6 Match Away Rating
You will see that Everton has a Last 6 Match Home Rating of 159.04%.
This means that Everton have won 59.04% more points from their last 6 matches than expected. In other words, Everton has been over-achieving in their last 6 matches.
Arsenal have a Last 6 Match Away Rating is 65.55%.
This means that Arsenal have won only 65.55% of the points that would be expected in their last 6 matches.
Basically, if a team has a Last 6 Match (Home or Away) Rating of 100%, this would mean that the team has won exactly the number of points that are expected.
If a team has a rating greater than 100%, it has over-achieved. By contrast, if a team has a rating of less than 100%, it has under-achieved.
So, let’s look at how the rating is calculated.
2. Probability
On the right of the grey box with “Prob” inside, there is a list of probabilities for the Home Win, Draw and Away win.
The historical football data, that I get, contains average bookmakers’ odds for the home win, draw and away win.
These odds can be converted into percentages in the following way.
You divide 100 by each of the odds. So, let’s say that you have odds of:
Home: 1.94
Draw: 3.48
Away: 4.12
You would end up with the following percentages:
Home: 100 ÷ 1.94 = 51.55%
Draw: 100 ÷ 3.48 = 28.74%
Away: 100 ÷ 4.12 = 24.27%
If we add these percentages up, we get 104.56%.
They add up to more than 100% due to the bookmakers’ overround.
So, to turn them into probabilities, that are scaled to a total of 100%, you just multiply the above probabilities by 100 and divide by 104.56.
Home: (100 x 51.55) ÷ 104.56 = 49.30%
Draw: (100 x 28.74) ÷ 104.56 = 27.49%
Away: (100 x 24.27) ÷ 104.56 = 23.21%
This adds up to 100%. These are close to the same probabilities that Everton had against Crystal Palace. The numbers aren’t exactly the same because, when I calculate this manually, I round every step of the calculation to 2 decimal points. Obviously, the calculator doesn’t do this.
3. XPts/Game (Expected Points Per Game)
XPts/Game reflects the average number of points that Everton would get, if the match against Arsenal was played an infinite number of times.
This is a simple calculation. We multiply the probability of the home win by 3 pts and the probability of a draw by 1 pt and add these 2 numbers together.
XPts = (Probability Home Win x 3 pts) + (Probability Draw x 1 pt)
In other words, Everton has a 49.30% chance of getting 3 pts and a 27.49% chance of getting 1 pt. We don’t have to do anything about the away win because this would be zero points.
So, (49.30% x 3) + (27.29% x 1) = 1.75 pts
We would do the same procedure for all 6 matches.
4. Pts (Actual Number of Points Won)
This refers to the actual number of points that Everton got from each game. So, because Everton won against Crystal Palace, they got 3 pts.
5. The Last 6 Match Home Rating
To calculate the Last 6 match Home Rating, the calculator add up the points that Everton obtained in the 6 matches and divide this by the total number of expected points. The result of this is multiplied by 100.
So, the formula is:
(Total Pts/Total XPts) x 100
To calculate the away team’s rating, we follow exactly the same procedure, except we would be calculating XPts from the away team’s perspective.
Step 2: Weigh Up the Luck Factor
So, we know from the above calculations that, based on points gained in the last 6 games, Everton has over-achieved, while Arsenal has under-achieved. However, the analysis doesn’t stop there.
The questions are:
Have Everton just been lucky or have they been playing well?
Have Arsenal been unlucky or have they been playing badly?
To answer these questions, we need to look at the statistics.
1. Shots on Target and Luck
The main statistic that we need to look at is shots on target.
As mentioned before, we should always be aware that probability is involved in football.
Let’s use Mo Salah as an example. According to premierleague.com statistics, Mo Salah scored 23 goals and had 60 shots on target during the 2021/2022 Premier League season.
This means that his shots on goal have just over a 38% chance of hitting the back of the net.
Although Mo Salah has a high strike rate, a 38% chance of a shots on goal converting to goal, will naturally involve long runs of missing the back of the net.
In other words, a player can go through streaks of missing the goal just by chance. He may also go through periods of scoring more often than expected just by chance.
The media will present these chance streaks as Mo Salah being on or off form. However, the reality is that Mo Salah probably plays consistently and his goal drought and goal fest periods just represent random variation.
If you think of random games that you might have played, you will have seen variation. For example, if you need a specific number to come in from the bar in backgammon, you can sometimes miss that number for, what seems like, an incredible number of dice rolls.
In this case, you are rolling 2 dice to hit a single number between a 1 and a 6 with at least one of the dice. The probability of hitting your number is 30.56%. Interestingly, this is very close to the percentage of shots on target that Harry Kane converted into a goal (31%) during the 2021/2022 Premier League season.
As a team, Man City’s shots on goal to goal conversion was around 38% last season.
Therefore, teams can play well and lose or draw just by chance. Conversely, teams can play badly and convert their only goal-scoring opportunity into a goal.
For this reason, when trying to determine whether a team was lucky or unlucky, shots on goal is the most important statistic to look at.
2. Compare Statistics from Different Time Periods
The idea here is to look at shots on goal and compare the 6 match statistics with the 1 year statistics. You can also compare the 6 match statistics with longer statistics. However, for now, we will just compare the 6 match and the 1 year statistics.
Figure 2: 6 Match Statistics (Home versus Away)
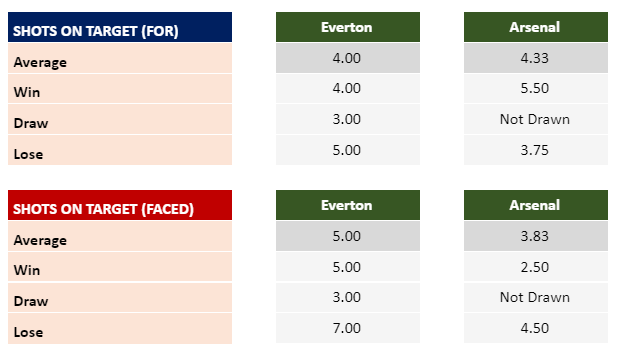
So, the way that I set the statistics up, is so we can see the effects of each statistic on the win rate of a team. I like to look at how each statistic might affect a team’s results. In addition, want to see how their results are affected by shots on target that they faced from the opposition.
In the above results, we can see that Everton has had average shots on target of 4 and faced and average of 5 shots on target.
Arsenal has had an average of 4.33 shots on target and faced an average of 3.83.
Figure 3: 1 Year Match Statistics (Home versus Away)
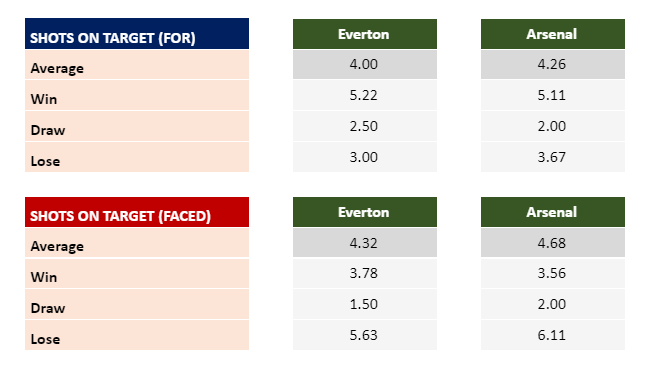
So, let’s start with Everton. On shots on target (for), there is no difference between the averages. However, on shots on target faced, there is a difference.
On the 6 game statistics, the average shots on target faced is 5.0. On the one year statistics, the average shots on target faced is 4.32. In other words, Everton’s 6 match statistics are worse than their 1 year statistics.
Although the difference between 5 and 4.32 might seem like a small difference, it is a 14% difference. In addition, the difference does not support an improvement in form, but rather weaker recent form.
Even if you don’t believe that this difference is significant, we can say that there isn’t an improvement from the 1 year to the 6 match statistics.
Therefore, we can say that, although Everton have had better results, the team has not shown a statistical improvement.
This suggests that Everton have just been lucky.
Let’s look at Arsenal. In the 6 match statistics, Arsenal have had an average of 4.33 shots on target, while in the 1 year statistics, they have had 4.26 shots on target. Therefore, there is very little difference between the 2 sets of statistics on this measure.
How about shots on target faced? The 6 weeks statistics show that Arsenal have faced an average of 3.83 shots on target. In the 1 year statistics, Arsenal have faced an average of 4.68 shots on target.
In other words, Arsenal have faced 19% less shots on target in the last 6 matches, compared to their average over the past year.
This suggests that Arsenal have been unlucky. Their shots on target haven’t been converting into goals.
Figure 4: 5 year Statistics (Home and Away)
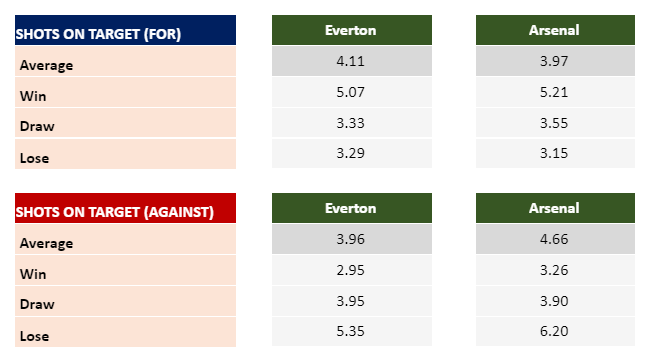
I go even further with my analysis and I look at the 5 year statistics. Generally, the 5 year statistics show a similar picture.
For Everton, there isn’t much difference on their shots on target between datasets. However, they have faced more shots on target in the 6 match analysis, compared to the 5 year analysis.
For Arsenal, they have had more shots on target and less shots faced, on average, during the last 6 games, compared to the 5 year average.
So, again, this suggests that Everton have had a run of good luck, whereas Arsenal have had a run of bad luck.
So, this is a scenario, where you might find value. The average punter just looks at recent form and this might knock the market away from its real odds. This effect might not be permanent. As you get closer to the start of the match, I would expect the odds to become more efficient.
Therefore, you might find value at some point during the day of the match or even a day or 2 before the match. The downside of betting early is that you won’t know who is on the team sheets. However, if you wait until all the information is presented, you might have left it too late to find value.
Everton have just as much chance of having a key player missing, compared to Arsenal. In addition, Arsenal have more depth than Everton in their squad. Therefore, compared to Everton, it is easier for Arsenal to find a reasonable replacement for a strong player.
The Moral of this Analysis
There are several ideas to be taken from this analysis.
1. You need to know where your statistics come from to make any sense of them.
Statistics are meaningless if you don’t have any idea of the timescale that they were derived from. You can compare statistics from different time periods to get a handle on what the statistics mean.
2. The odds represent probabilities and not certainties.
We should always remember that odds represent probabilities. Too often, I see people thinking of odds as certainties.
3. When analysing the form of a team, you must examine the luck factor.
In this lesson, I explained how to identify whether a team has over- or under-achieved and whether changes in results are due to the luck factor.
OVER 18 ONLY

LEGAL STUFF
UK LEAGUES
EUROPEAN LEAGUES
OUTSIDE EUROPE LEAGUES
© 2022 Exploitative Betting · All Rights Reserved